
Contents
Introduction
Even though Java has progressed significantly with more sophisticated algorithms that can function well with modern applications, you may still need to tweak your (Java Virtual Machine) JVM performance to meet your application’s needs. The needs and requirements of applications may vary when it comes to scalability and performance.
That’s why you need to consistently monitor your JVM performance to tune it accordingly.
There are a handful of critical metrics you should focus on – memory usage, garbage collection, and threads. We can monitor these metrics by exposing application JMX objects to Prometheus using JMX Exporter and creating required graphs in Grafana. To do so follow below steps.
- Download the Java JMX Exporter Jar
Download the JMX Exporter Jar from MVN Repository and place the
downloaded .jar file at the classpath
- Configure Config.yaml file for your application
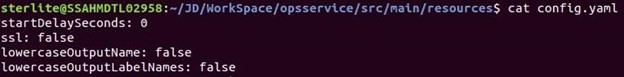
In our case, we’ll use a very basic configuration that will expose all metrics. But this file can be used to provide fine-grained control over which mBeans are exported. For more information click GITHUB.
- Run a Jar as java agent
java $JAVA_OPTS -javaagent:./jmx_prometheus_javaagent-0.13.0.jar=8080:config.yaml -Xlog:gc=debug:file=gc.txt -DApp.config.file=application.properties -cp “orderauditservice.jar:*” org.springframework.boot.loader.JarLauncher
Metrics will now be accessible at http://localhost:8080/metrics
- Verify published metrics from Prometheus
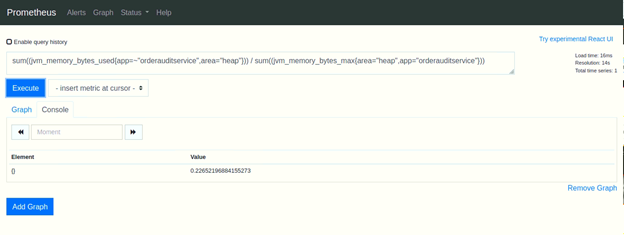
Heap Usage Percentage
- Prepare Sample Grafana Dashboard using Prometheus metrics
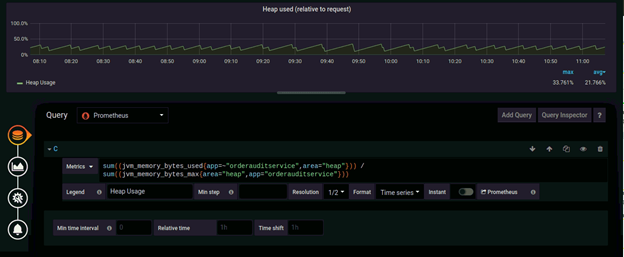
Heap Memory Monitoring
The heap memory is where the JVM stores runtime data. This is where memory for new objects comes from. Once the requests are served, these objects should be cleared or unreferenced. If they’re not, the objects will keep occupying the heap space, heap space runs out and the JVM throws an Out of Memory Error (OOM). That’s why it is critical to monitor Heap usage.
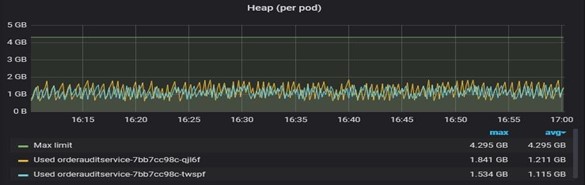
In the graph above, you can see average heap usage, max heap usage and max allocated heap memory
- What to look for in the metrics?
- Monitor heap memory usage and know whether the JVM is sized correctly.
- Know if the heap memory has exceeded the reserved memory for the JVM.
If you observe a sudden spike in the heap memory usage at a particular time, you can correlate the application response time with the number of requests and check if the spike is because of increased requests or an improper code base.
Garbage Collection Monitoring
Garbage Collection (GC) discards unreferenced Objects from the Heap, reclaiming the space for application use. JVM initiates a garbage collection process whenever it needs to.
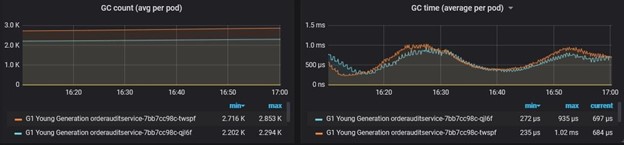
In the graph above, you can see min GC Count, max GC Count, min GC Time, and max GC Time.
- What to look for in the metrics?
- How often GC runs
- Time taken for each GC
GC can become a resource intensive process. So, when GC happens too frequently OR when the time taken to collect the unreferenced objects is too high, it affects your application’s performance. This also can be another indication of a memory leak, or it can simply mean the application needs more heap space.
Threads Monitoring
Threads are always at the center stage of any application. Threads are responsible for serving user requests.
It is important to have sufficient free threads to accept all user requests. If you don’t have enough threads, this will increase the wait time for a user request and in turn increase the application response time.
When a thread takes a longer time to complete the user requests, it holds the referenced objects in the heap memory for a longer period of time. This in turn affects the memory space and may lead to OOM or GC issues.
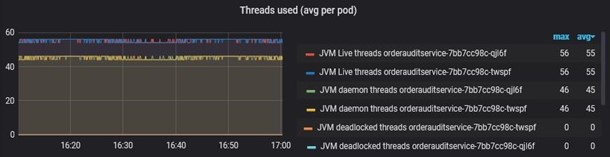
In the graph above, you can see Live, Demon and Deadlocked thread counts.
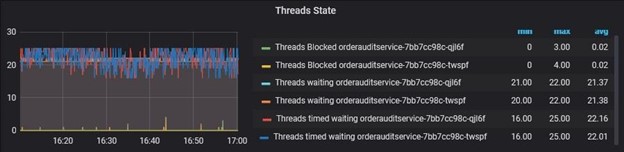
In the graph above, you can see Blocked, Waiting and Timed Waiting thread counts.
- What to look for in the metrics?
- Monitor live, blocked, waiting and deadlocked threads
- Measure wait time for each thread
It is also important not to have too many active threads. A higher number of threads means an increase in processor utilization caused by the application. This is mainly due to the processing power required by each thread. The need for the processor to frequently switch between threads also causes additional work. It may slow down your application, and even the server it runs on.
Conclusion:
The JVM is a complex process that requires monitoring for several key metrics that indicate the health and performance of your running application. Using JMX exporter, we can keep such metrics handy to monitor via Grafana.