
Contents
Introduction
In a cloud-native environment, it is very essential to publish custom metrics of your application for monitoring and to ensure better application health. The user should have data and proper channels available to measure application health. We can publish and monitor a large number of metrics in a simple way.
This requires 3 components in this monitoring system setup:
- Application exposing custom KPI
- Prometheus for metrics scraping
- Grafana for visualization
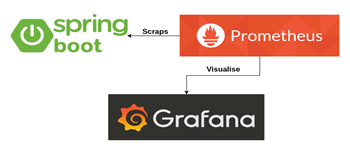
Nothing special needs to be done to record custom KPIs to Prometheus. We are using a Gradle based Spring Boot application to demonstrate the same.
Prerequisite:
Basic understanding of Prometheus and Grafana configuration.
Custom KPIs Configuration
For a spring boot application to expose custom KPIs follow the steps below.
- Add the following dependencies in the Gradle file.
- Spring boot actuator
- Micrometer registry

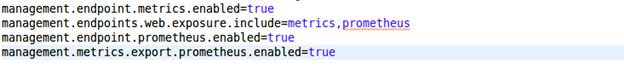
2. Do the below configuration in the “application.properties” file to enable metrics on the “/actuator/prometheus” endpoint
3. Once the configuration is done, you can add different custom KPI’s to find ‘request execution time’, ‘the total number of requests received’ , ‘find time-consuming API’s, etc.
In the below example, we have added a custom KPIs using Micrometer Library to
- Record the time taken by creating a User API
- Record the total number of requests received by the application.
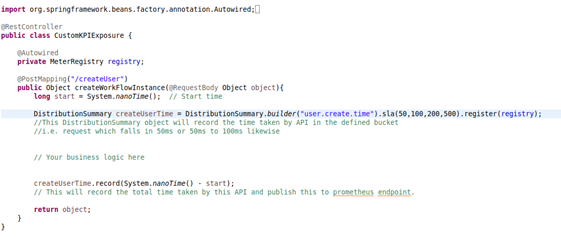
- The Distribution Summary object records the time taken by the API in the defined bucket, i.e. a request which completes execution in 50ms or between 50ms to 100ms.
- We can also customize the metrics data as per requirement like recording average execution time etc. “user.create.time” is the query name which in Prometheus will be available by metrics name “user_create_time”. You can also verify metrics on IP:PORT/application_context_path/actuator/metrics/
- For a more detailed understanding please refer to this link Micrometer documentation
❖ Prometheus metrics scrapping configuration
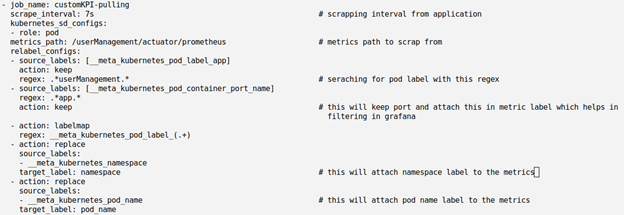
To scrap metrics from your application add the below configuration in Prometheus configmap.
Prometheus metrics scrapping configuration
To scrap metrics from your application add the below configuration in Prometheus configmap.
❖ Visualizing in Grafana
Once all the metrics data is available in Prometheus, You can add different dashboards in Grafana for better visualizations and monitoring. Grafana also supports configuration to set notification alerts based on the published metrics.
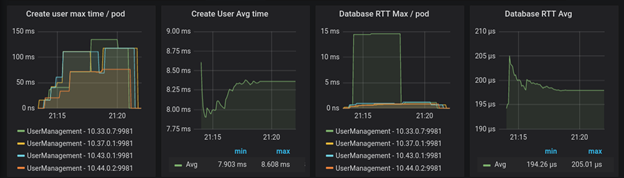
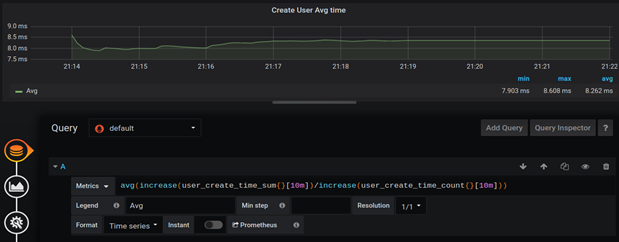
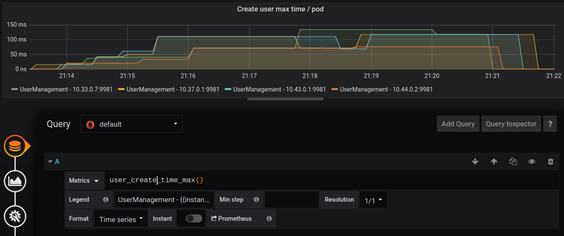
The dashboard provides useful information like max and average execution time taken for creating a user, time taken for database operation. With careful monitoring of these dashboards, we can find whether our application is working as per the expectations or not. And if not then we can identify the APIs which are taking more time.
Conclusion:
Micrometer makes it easy to instrument an application and collect a good set of basic metrics which can be stored and visualized using Prometheus and Grafana. You can create metrics according to your needs as this library provides much more than this.